Chapter 2: Introduction to Machine Learning Systems Design
18 min readThis chapter will guide us through:
- Objectives: Why are we building this system in the first place?
- Requirements: What qualities must our system possess? (Think reliability, scalability).
- Iterative Process: Spoiler: building ML systems is rarely a straight line.
- Problem Framing: How do we turn a vague business problem into a concrete ML task? This is crucial.
- And finally, a bit of a philosophical discussion: Data vs. Algorithms.
You’ll see a recurring theme: “Not so soon!” Before you jump to coding a model, there’s a lot of critical thinking and planning. This upfront work is what separates a successful, production-ready ML system from a science project. This chapter is packed with concepts that will come up in ML system design interviews.
Let’s get to it!
Page 1 (of Chapter 2 text): Reiteration and Roadmap
This page just sets the stage, reminding us of the holistic view from Chapter 1. The key components are:
- Business requirements
- Data stack
- Infrastructure
- Deployment
- Monitoring
- And, importantly, the stakeholders involved.
The chapter will flow from high-level objectives down to the specifics of framing the ML task. The author teases: “The difficulty of your job can change significantly depending on how you frame your problem.” This is an understatement! A good problem framing can save you months of effort.
Pages 2-4: Business and ML Objectives – The “Why”
This is the absolute starting point for any ML project, especially in a business context like FAANG.
ML Objectives vs. Business Objectives:
- Data Scientists often focus on ML Objectives: These are metrics we can directly measure from our model – accuracy, precision, recall, F1-score, RMSE, inference latency. We get excited about tweaking a model to push accuracy from 94% to 94.2%.
- Companies care about Business Objectives: The truth is, most businesses don’t care about that 0.2% accuracy bump unless it translates into something meaningful for them. This means:
- Increasing revenue (e.g., more sales, higher ad click-through rates)
- Reducing costs (e.g., less fraud, more efficient operations)
- Improving user engagement (e.g., more time on site, higher monthly active users)
- Increasing customer satisfaction.
The book quotes Milton Friedman: “The social responsibility of business is to increase its profits.” While this is a specific economic viewpoint, the underlying message for us is that ML projects within a business context must ultimately contribute to the business’s success.
The Pitfall:
A very common failure pattern, as the book highlights (citing Eugene Yan’s excellent post), is when data science teams get lost in “hacking ML metrics” without connecting them to business impact. If your manager can’t see how your fancy model is helping the business, the project (and sometimes the team) might get cut.
FAANG Perspective: This is a constant conversation. PMs will always ask, “How does this new model move our North Star metric?” If you propose a project, you need to have a hypothesis about its business impact.
Mapping ML Metrics to Business Metrics: This is key.
- Easy Mappings: For ad click-through rate (CTR) prediction, an increase in model AUC (an ML metric) often directly correlates with increased ad revenue (a business metric). For fraud detection, better precision/recall directly means less money lost.
- Harder Mappings / Custom Metrics:
- Netflix’s “take-rate”: (quality plays) / (recommendations shown). They found a higher take-rate correlated with more streaming hours and lower subscription cancellations (business metrics). This is a great example of a derived metric that bridges the ML and business worlds.
- Recommender Systems: An e-commerce site wants to move from batch to online recommendations. Hypothesis: online recommendations are more relevant -> higher purchase-through rate. Experiment: Show X% improvement in predictive accuracy (ML metric) from online. Historically, Y% accuracy improvement led to Z% purchase-through rate increase (business metric).
A/B Testing is Crucial: Often, the only way to truly know if your ML model is improving business metrics is through rigorous A/B testing. You might have a model with slightly worse offline ML metrics (e.g., accuracy) that performs better in an A/B test on the actual business KPI. The A/B test is usually the ultimate decider.
The “AI-Powered” Hype vs. ROI (Return on Investment):
- Many companies want to say they’re “AI-powered” because it’s trendy. But ML isn’t magic. It doesn’t transform businesses overnight.
- Google’s success with ML came from decades of investment.
Maturity Matters (Figure 2-1): This graph from Algorithmia is insightful.
- Companies sophisticated in ML (models in production > 5 years) can often deploy new models in < 30 days (almost 75% of them).
- Those just starting often take > 30 days (60% of them).
- This shows that mature MLOps pipelines, experienced teams, and established processes significantly speed up development and deployment, leading to better ROI.
Interview Tip: When asked to design a system, implicitly consider the company’s maturity. A startup will have different constraints and capabilities than Google.
Attribution in Complex Systems:
Sometimes ML is just one small cog in a huge machine. For a cybersecurity threat detection system, an ML model might detect anomalies, which then go through rule-based filters, then human review, then an automated blocking process. If a threat gets through, was it the ML model’s fault? Hard to say. This makes direct attribution of business impact tricky.
Self-Correction/Interview Tip: In an ML system design interview, the first thing you should clarify is the business objective. “What are we trying to achieve for the business? What is the key metric we want to move?” This shows you’re thinking about the big picture, not just the tech.
Pages 5-7: Requirements for ML Systems – The “What”
Once objectives are clear, we define system requirements. These are often non-functional requirements that dictate the quality and robustness of our system. The book focuses on four:
Reliability (Page 5): The system should perform its correct function at the desired level of performance, even in the face of adversity (hardware/software faults, human error).
- “Correctness” is tricky for ML: A traditional software system might crash or throw an error. ML systems can fail silently. Google Translate might give you a grammatically correct sentence that means the opposite of the original, and if you don’t know the target language, you’d never know!
- How do we know a prediction is wrong if we don’t have ground truth for new, unseen data in real-time? This leads to the need for robust monitoring (Chapter 8).
- FAANG Perspective: Silent failures are a nightmare. Imagine a recommendation system silently starts recommending inappropriate content. Robust monitoring and alerting are paramount.
Scalability (Pages 6-7): The system’s ability to handle growth. Growth can occur in several dimensions:
- Model Complexity: From logistic regression (1GB RAM) to a 100M parameter neural net (16GB RAM).
- Traffic Volume: From 10k daily requests to 1-10M daily requests.
- Model Count:
- One model for one use case (e.g., trending hashtag detection).
- Adding more models for the same use case (e.g., NSFW filter, bot filter).
- One model per customer in enterprise scenarios (author mentions a startup with 8,000 models for 8,000 customers). This is common in B2B SaaS where models are fine-tuned on customer-specific data.
- Resource Scaling:
- Scaling up: Bigger machine. Scaling out: More machines (footnote 8).
- Autoscaling: Automatically adjusting resources (e.g., GPUs) based on demand. Peak might need 100 GPUs, off-peak only 10. Keeping 100 GPUs always on is expensive.
- Autoscaling is tricky! Amazon’s Prime Day autoscaling failure example (costing $72M-$99M in an hour) shows even the giants can struggle.
- Artifact Management: Managing 100 models is vastly different from 1. Manual monitoring/retraining is not feasible. Need automated MLOps pipelines, code generation for reproducibility.
- The book cross-references later chapters covering distributed training, model optimization, resource management, experiment tracking, and development environments, all related to scalability.
- Interview Tip: Always consider scalability. “What happens if traffic 10x-es? What if the number of items to recommend 10x-es?” Be prepared to discuss strategies like sharding, caching, load balancing, and autoscaling.
Maintainability (Page 7): Making it easy for various teams (ML engineers, DevOps, Subject Matter Experts - SMEs) to operate, debug, and evolve the system.
- Teams have different backgrounds, tools, programming languages.
- Needs:
- Well-structured workloads and infrastructure.
- Good documentation (often overlooked but critical!).
- Versioning of code, data, and artifacts (models).
- Reproducibility: Can someone else reproduce your model and results if you leave?
- Collaborative debugging without finger-pointing.
- The book mentions “Team Structure” (page 334) in this context.
- FAANG Perspective: Maintainability is huge for long-term cost of ownership. Complex, poorly documented systems become “tribal knowledge” nightmares. We invest heavily in tools and processes for versioning, reproducibility (e.g., model registries, feature stores), and clear ownership.
Adaptability (Pages 7-8): The system’s ability to evolve with:
- Shifting data distributions (data drift, concept drift): What users search for changes, spam tactics evolve. (Covered in “Data Distribution Shifts” on page 237).
- Changing business requirements.
- The system needs capacity to discover opportunities for improvement and allow updates without service interruption. (Covered in “Continual Learning” on page 264).
- Tightly linked to maintainability.
- Interview Tip: “How will your system adapt to changing user behavior or new product features?” This leads to discussions of online learning, retraining frequency, and monitoring for drift.
These four requirements are often interconnected and sometimes involve trade-offs. For instance, a highly scalable system might introduce complexity that challenges maintainability.
Pages 8-10: Iterative Process – The “How Often”
Forget the idea of a linear, one-shot ML project: Collect data -> Train model -> Deploy -> Done. It’s a myth!
ML development is iterative and often never-ending. (Footnote 10: “a property of traditional software” – true, but often more pronounced in ML due to data dependency). Once in production, it needs continuous monitoring and updating.
Example Workflow (Ad Prediction - Steps 1-13): This is a fantastic illustration of the cyclical nature:
- Choose metric (e.g., impressions).
- Collect data/labels.
- Feature engineering.
- Train models.
- Error analysis -> realize labels are wrong -> relabel.
- Train again.
- Error analysis -> model always predicts “no ad” (due to 99.99% negative labels - class imbalance!) -> collect more positive data.
- Train again.
- Model good on old test data, bad on recent data (stale!) -> update with recent data.
- Train again.
- Deploy.
- Business feedback: Revenue decreasing! Ads shown, but few clicks. Original metric (impressions) was wrong. Change to optimize for click-through rate.
- Go to step 1. (And as footnote 11 hilariously adds: “Praying and crying not featured, but present through the entire process.” So true.)
Figure 2-2 (Simplified Iterative Cycle):
- Project Scoping: Goals, objectives, constraints, stakeholders, resources. (Covered in Ch1 and earlier in Ch2, also Ch11 for team organization).
- Data Engineering: Handling sources/formats (Ch3), curating training data (sampling, labeling - Ch4).
- ML Model Development: Feature extraction (Ch5), model selection, training, evaluation (Ch6). (This is the “sexy” part often overemphasized in courses).
- Deployment: Making model accessible to users (Ch7). “Like writing, you never reach done, but you reach a point where you have to put it out there.”
- Monitoring and Continual Learning: Performance decay, adapting to changes (Ch8 & Ch9).
- Business Analysis: Evaluate model against business goals, generate insights, decide to kill/scope new projects. (This closes the loop back to Step 1).
Notice the dashed arrows in Figure 2-2: you can jump between these stages. Error analysis in model development (3) might send you back to data engineering (2). Business analysis (6) might redefine project scope (1).
The perspective of an ML platform engineer or DevOps engineer might differ; they’d focus more on infrastructure setup.
Self-Correction/Interview Tip: When outlining your approach in an ML system design interview, always frame it as an iterative process. Mention baselines, prototyping, feedback loops, and phased rollouts. This demonstrates a mature understanding of real-world ML development.
Pages 11-19: Framing ML Problems – The “What Exactly”
This is where your expertise as an ML engineer truly shines. You take a business problem and translate it into something ML can solve.
Business Problem vs. ML Problem:
- Boss’s request: “Rival bank uses ML to speed up customer service by 2x. Do that.” This is a business problem, not an ML problem.
- ML problem needs: Inputs, Outputs, Objective Function.
- Your job: Investigate. Bottleneck is routing requests to Accounting, Inventory, HR, IT.
- ML Framing: Predict which department a request should go to.
- Input: Customer request text.
- Output: Predicted department (one of four).
- Task Type: Classification.
- Objective function: Minimize difference between predicted and actual department.
Types of ML Tasks (Page 12-14, Figure 2-3): The model’s output dictates the task type.
Classification vs. Regression:
- Classification: Output is a category (e.g., spam/not-spam, cat/dog/mouse).
- Regression: Output is a continuous value (e.g., house price, temperature).
- They can be interchanged (Figure 2-4):
- House price regression -> classification by bucketing prices (e.g., <$100k, $100k-$200k).
- Email spam classification -> regression by outputting a spamminess score (0-1), then thresholding.
- FAANG Perspective: Choosing classification vs. regression can have subtle implications for user experience and error analysis. Sometimes a score is more nuanced than a hard class label.
Within Classification:
- Binary Classification: Two classes (e.g., fraud/not-fraud, toxic/not-toxic). Simplest. F1, confusion matrices are intuitive.
- Multiclass Classification: More than two classes, an example belongs to exactly one (e.g., classifying an image as cat OR dog OR bird).
- High Cardinality Classification: Many classes (e.g., thousands of diseases, tens of thousands of product categories).
- Challenge 1: Data Collection. Often need many examples per class (author suggests ~100). For 1000 classes, that’s 100,000 examples. Difficult for rare classes.
- Strategy: Hierarchical Classification. First classify into broad categories (e.g., electronics, fashion), then a second model classifies into subcategories (e.g., shoes, shirts within fashion). This is common in product categorization at Amazon or e-commerce sites.
- Multilabel Classification: An example can belong to multiple classes simultaneously (e.g., an article can be about ’tech’ AND ‘finance’).
- This is often the trickiest!
- Labeling: Annotator disagreement is common (see Chapter 4). One says 2 labels, another says 1.
- Prediction: If model outputs probabilities [0.45 (tech), 0.2 (ent), 0.02 (fin), 0.33 (pol)], how many labels do you pick? The top one? Top two? This requires careful thresholding or learning the number of labels.
- Two Approaches:
- Treat as multiclass with a multi-hot encoded target vector (e.g., [0, 1, 1, 0] for entertainment and finance).
- Train multiple binary classifiers (one for each topic: “is it tech?”, “is it entertainment?”). This is often simpler to manage and interpret.
Interview Tip: Clearly state your problem framing, including the task type. Be ready to justify why you chose that framing and discuss alternatives.
Multiple Ways to Frame a Problem (Pages 15-16, Figures 2-5, 2-6): Next App Prediction
- Problem: Predict the app a user will most likely open next.
- Naive Framing (Multiclass Classification - Figure 2-5):
- Input: User features (demographics, past apps), Environment features (time, location).
- Output: A probability distribution vector of size N (for N apps on the phone). [P(App0), P(App1), …, P(AppN-1)].
- Bad because: If a new app is installed (N changes), the output layer of your neural network changes. You have to retrain from scratch or at least a significant part of the model.
- Better Framing (Regression - Figure 2-6):
- Input: User features, Environment features, AND App features (category of app, metadata).
- Output: A single score (0-1) indicating likelihood of opening that specific app given the context.
- To recommend, you make N predictions (one for each app, feeding its features into the model) and pick the app with the highest score.
- Good because: If a new app is installed, you just featurize it and score it with the existing model. No retraining needed immediately. This is much more scalable and practical for dynamic environments like app stores.
- FAANG Perspective: This “Siamese” network-like approach (where you compare user context to item features) is very common in large-scale recommendation and search ranking systems.
Objective Functions (Page 16): AKA Loss Functions.
The function the model tries to minimize during training.
- For supervised learning, it compares model outputs to ground truth labels.
- Examples: RMSE or MAE for regression, Logistic Loss (Log Loss) for binary classification, Cross-Entropy for multiclass classification.
- The book gives a Python snippet for cross-entropy:
pis ground truth (e.g.,[0,0,0,1]),qis model prediction (e.g.,[0.45,0.2,0.02,0.33]). - Most ML engineers use standard loss functions; deriving novel ones requires deeper math.
- Important Note (footnote 12): These mathematical objective functions are different from the business/ML objectives we discussed earlier. The hope is that optimizing the mathematical loss function will improve the ML objectives, which in turn will improve business objectives. This chain isn’t always perfect!
Decoupling Objectives (Pages 17-18): What if you have multiple, potentially conflicting, goals?
- Example: Newsfeed Ranking.
- Initial goal: Maximize user engagement (clicks). Objectives: Filter spam, filter NSFW, rank by click likelihood.
- Problem: Prioritizing engagement alone leads to extreme content (clickbait, outrage). (Footnote 13 cites Facebook/YouTube examples).
- New goal: Maximize engagement AND minimize extreme views/misinformation.
- New objectives: Filter spam, filter NSFW, filter misinformation, rank by quality, rank by engagement.
- Now, quality and engagement might conflict. A high-quality post might be boring; an engaging post might be low-quality.
- Approach 1: Combined Loss Function:
loss = alpha * quality_loss + beta * engagement_loss- Train one model to minimize this combined loss.
- Problem: Tuning alpha and beta is tricky. Every time you adjust them (e.g., business decides quality is more important), you have to retrain the entire model.
- Approach 2: Decouple - Train Separate Models:
quality_model: Minimizesquality_loss, predictsquality_score.engagement_model: Minimizesengagement_loss, predictsengagement_score.- Combine scores at inference time:
final_score = alpha * quality_score + beta * engagement_score. - Advantages:
- You can tweak alpha and beta without retraining models. Much more agile.
- Easier maintenance: Spam techniques evolve faster than quality perception. The spam filter (part of quality) might need frequent updates, while the core engagement model might be more stable. Decoupling allows different maintenance schedules.
- FAANG Perspective: Decoupling objectives into separate models or model components is a very common and powerful pattern in complex production systems like search ranking, ad ranking, and feed ranking. It allows for modularity, independent iteration on components, and easier tuning of business trade-offs.
Pages 19-22: Mind Versus Data – The Big Debate
This is a fascinating, ongoing discussion in the ML community. What’s more important for progress?
- The Premise: “More Data Usually Beats Better Algorithms” (Anand Rajaraman, footnote 16). Many successes in the last decade (AlexNet, BERT, GPT) relied heavily on massive datasets. Companies increasingly focus on managing and improving their data.
- The Debate:
- “Mind” Camp: Emphasizes inductive biases, intelligent architectural designs, causal inference.
- Judea Pearl (Turing Award winner): “Mind over Data,” “Data is profoundly dumb.” He controversially tweeted that data-centric ML folks might be jobless in 3-5 years.
- Christopher Manning: Huge data + simple algorithm = “incredibly bad learners.” Structure helps learn from less data.
- “Data” (and Compute) Camp:
- Richard Sutton (“The Bitter Lesson”): General methods leveraging computation ultimately win by a large margin. Trying to bake in human domain knowledge gives short-term gains, but scaling computation is the long-term winner.
- Peter Norvig (on Google Search): “We don’t have better algorithms. We just have more data.” (This is from “The Unreasonable Effectiveness of Data,” Halevy, Norvig, Pereira).
- Monica Rogati’s “Data Science Hierarchy of Needs” (Figure 2-7): Data is foundational. You can’t do ML/AI (top of pyramid) without the lower levels: collect, move/store, explore/transform, aggregate/label.
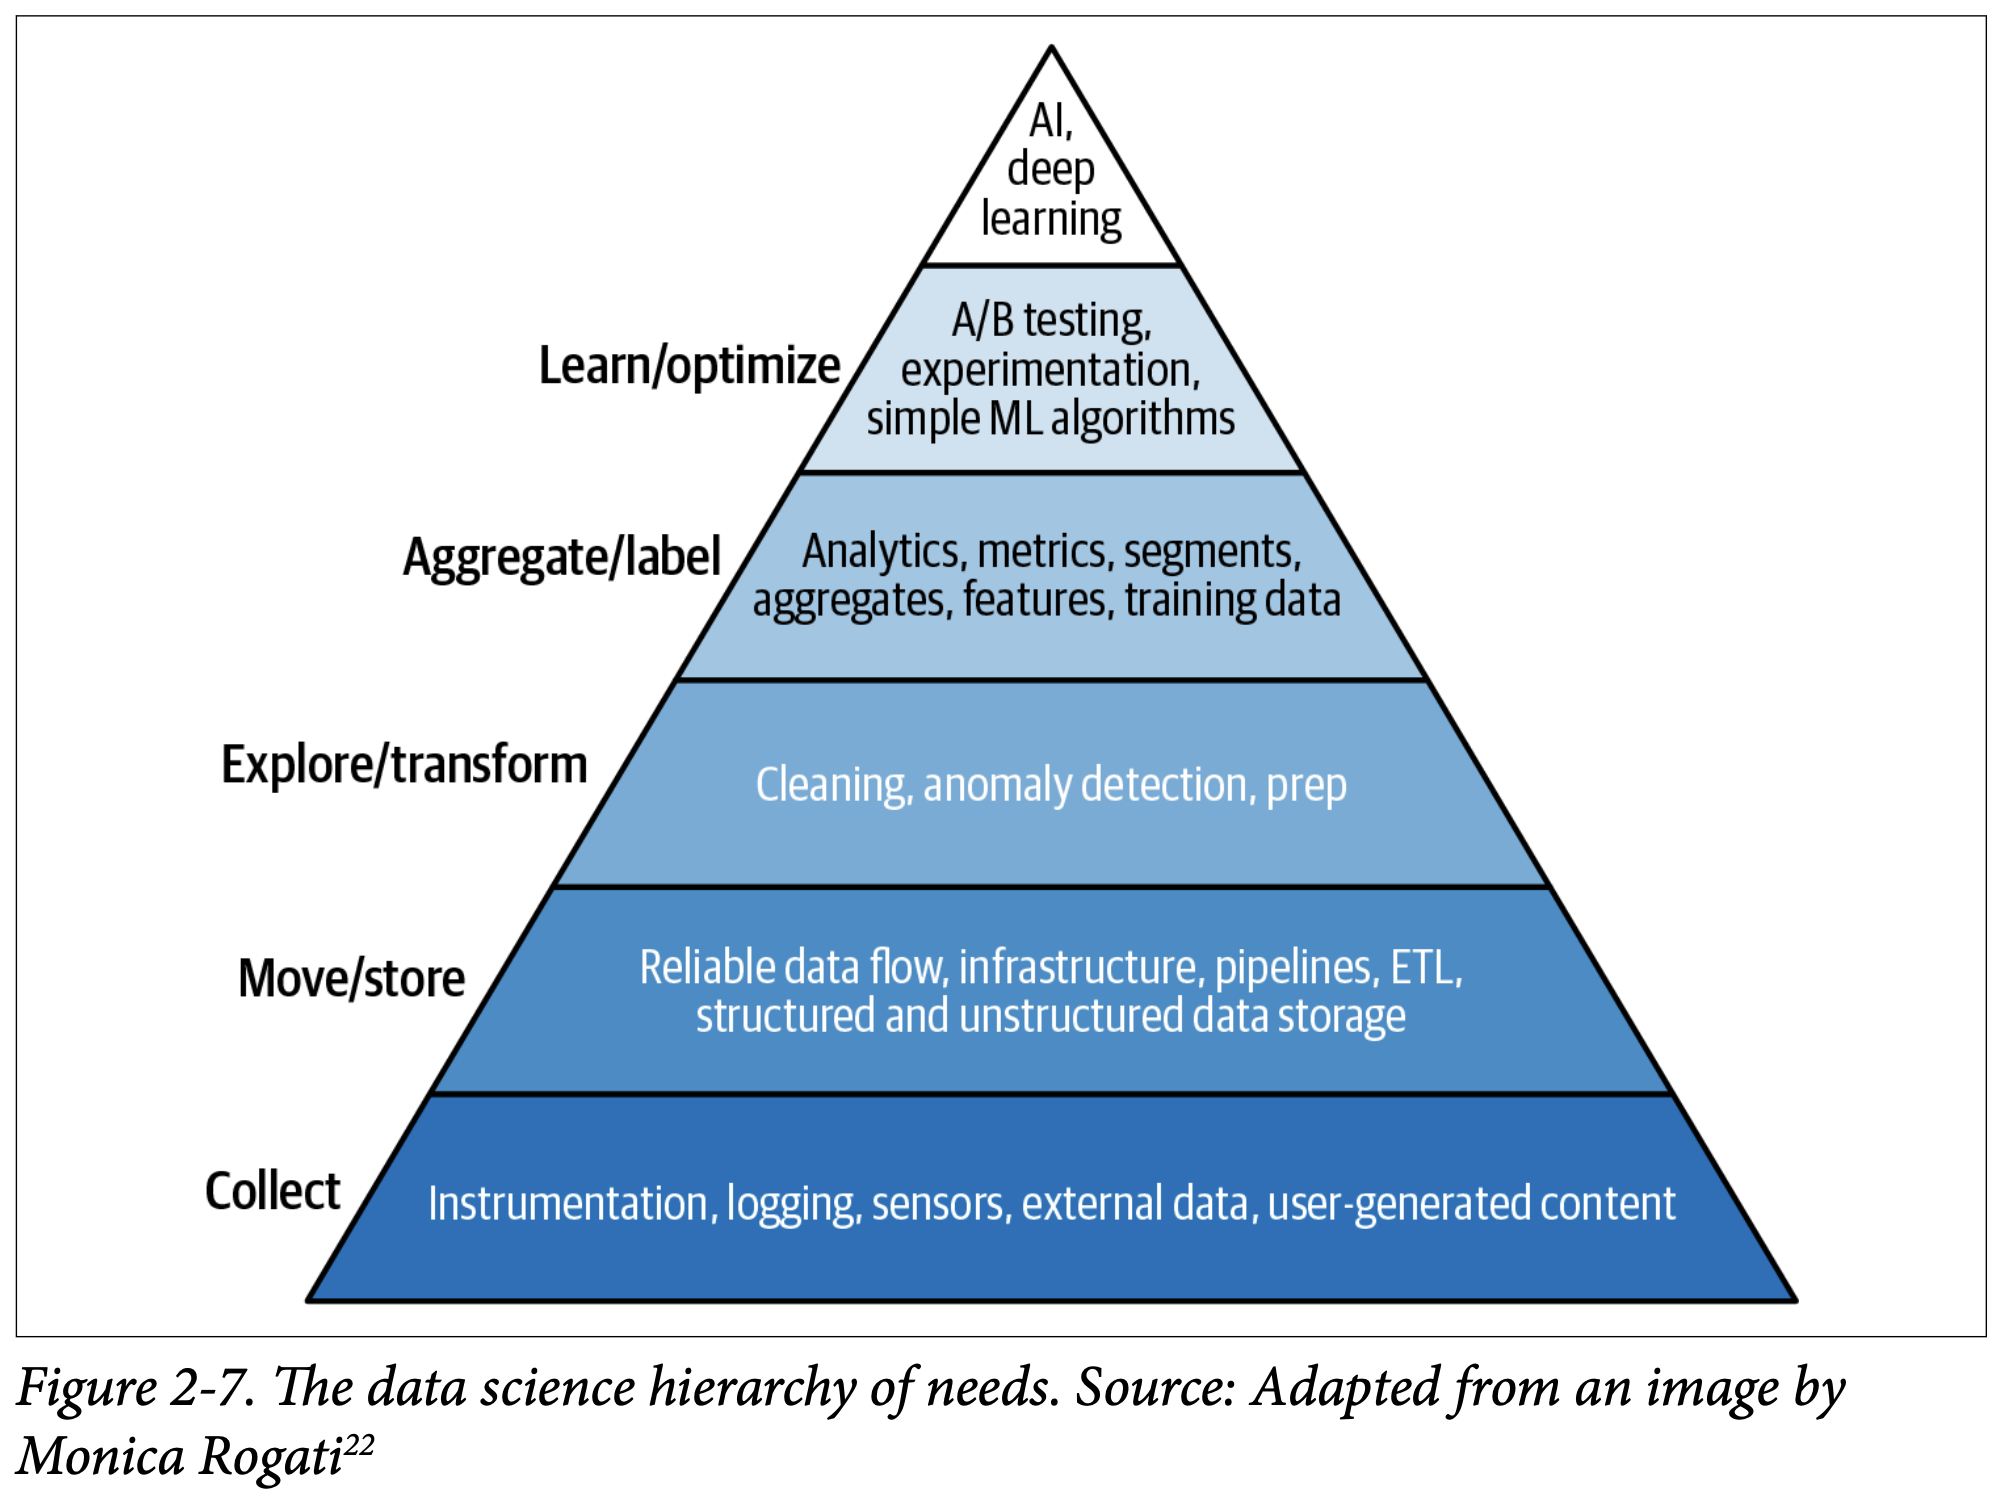
- Self-Correction: This hierarchy is a fantastic mental model. Often, companies want to jump to “AI” without solid data foundations, which is a recipe for failure.
- “Mind” Camp: Emphasizes inductive biases, intelligent architectural designs, causal inference.
- The Reality:
- Data is essential (for now): Quality and quantity matter.
- Dataset sizes are exploding (Figure 2-8): Language model datasets grew from PTB (few million tokens) to Text8 (100M) to One Billion Word (0.8B tokens, 2013) to GPT-2 (10B tokens) to GPT-3 (500B tokens).
- Caveat: More data isn’t always better. Low-quality data (outdated, incorrect labels) can hurt performance. This emphasizes the “quality” aspect.
- The debate isn’t whether finite data is necessary (it is), but whether it’s sufficient, or if “mind” offers a more efficient path. If we had infinite data, we could just look up answers. A lot of data is different from infinite data.
Interview Tip: While you won’t be asked to solve this philosophical debate, understanding it shows you’re aware of the field’s trends. You can articulate the practical importance of good data pipelines and also appreciate the research into more data-efficient or structured models.
Pages 22-23: Summary
Chapter 2 provides a crucial introduction to the ML system design process:
- Start with “Why”: Business objectives must drive ML project selection and definition. Translate business needs into ML objectives.
- Define Requirements: Systems need to be reliable, scalable, maintainable, and adaptable.
- Embrace Iteration: ML system development is a continuous cycle, not a one-shot deal.
- The Role of Data is Undeniable: While the “mind vs. data” debate continues, practical ML today heavily relies on access to large amounts of high-quality data. The book will devote significant attention to data questions.
- Building Blocks: Complex ML systems are made of simpler components. The following chapters will zoom into these, starting with data engineering.
If any of this feels abstract, the book promises concrete examples in later chapters. This chapter provides the mental framework you need to start thinking like an ML Systems Engineer. The principles here – tying to business value, defining non-functional requirements, iterative development, and careful problem framing – are universal.
Okay, that’s Chapter 2! A lot to digest, but incredibly important. What are your initial thoughts? Any of these points particularly resonate with your experiences or spark questions? This stuff is the bread and butter of what we do in production ML.